Better than the weather app that came with your phone.
Next-hour forecasts checked against 112 research grade rain gauges, hour by hour.
Inside the data
Know when rain starts and stops at your exact spot. Then come back after the storm for a measured record. This guide covers how Precip builds the nowcast, live precipitation, measured history, and multi-day forecast.
Better observations
We use high resolution radar and quality-controlled gauge data to observe precipitation and model accumulation on the surface of the earth. We continually refine our data to be the most accurate and useful source for monitoring rainfall, snow, and other types of precipitation.
Most weather data sources are based on forecasts, not observations. That means they are often inaccurate, and don't reflect what actually happened. Precip is based on actual observations from radar, satellites, and rain gauges.
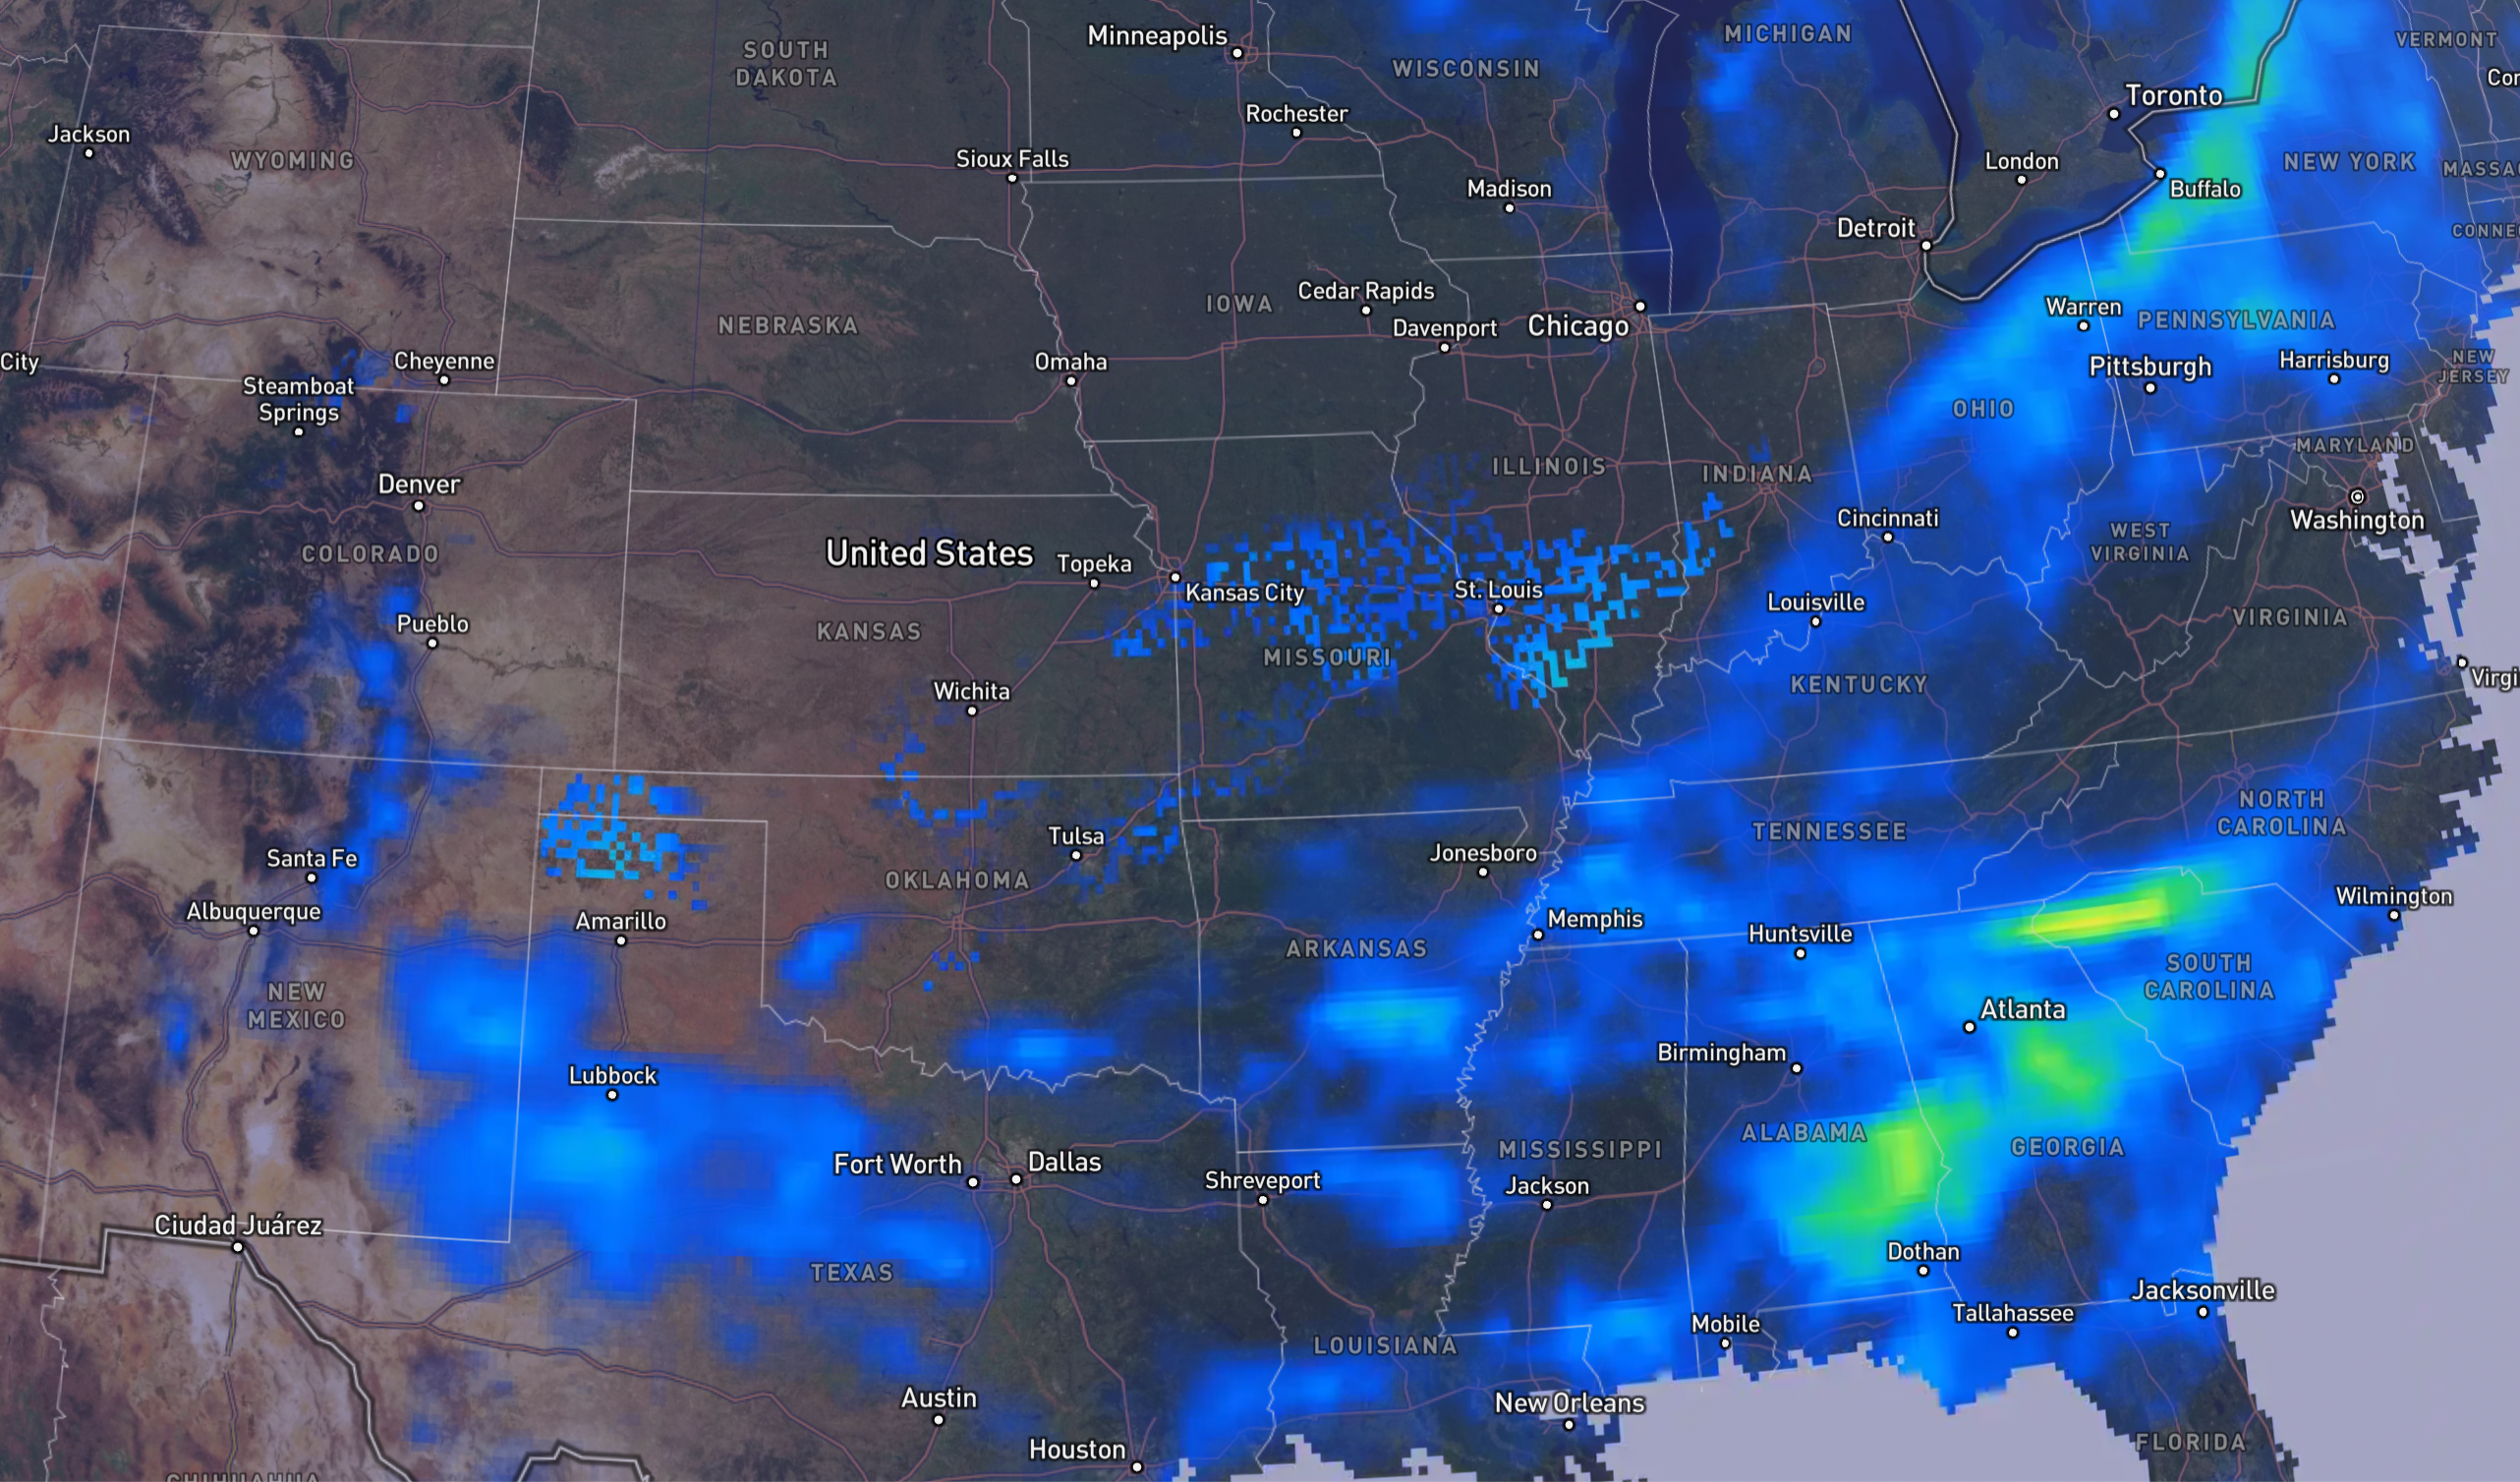
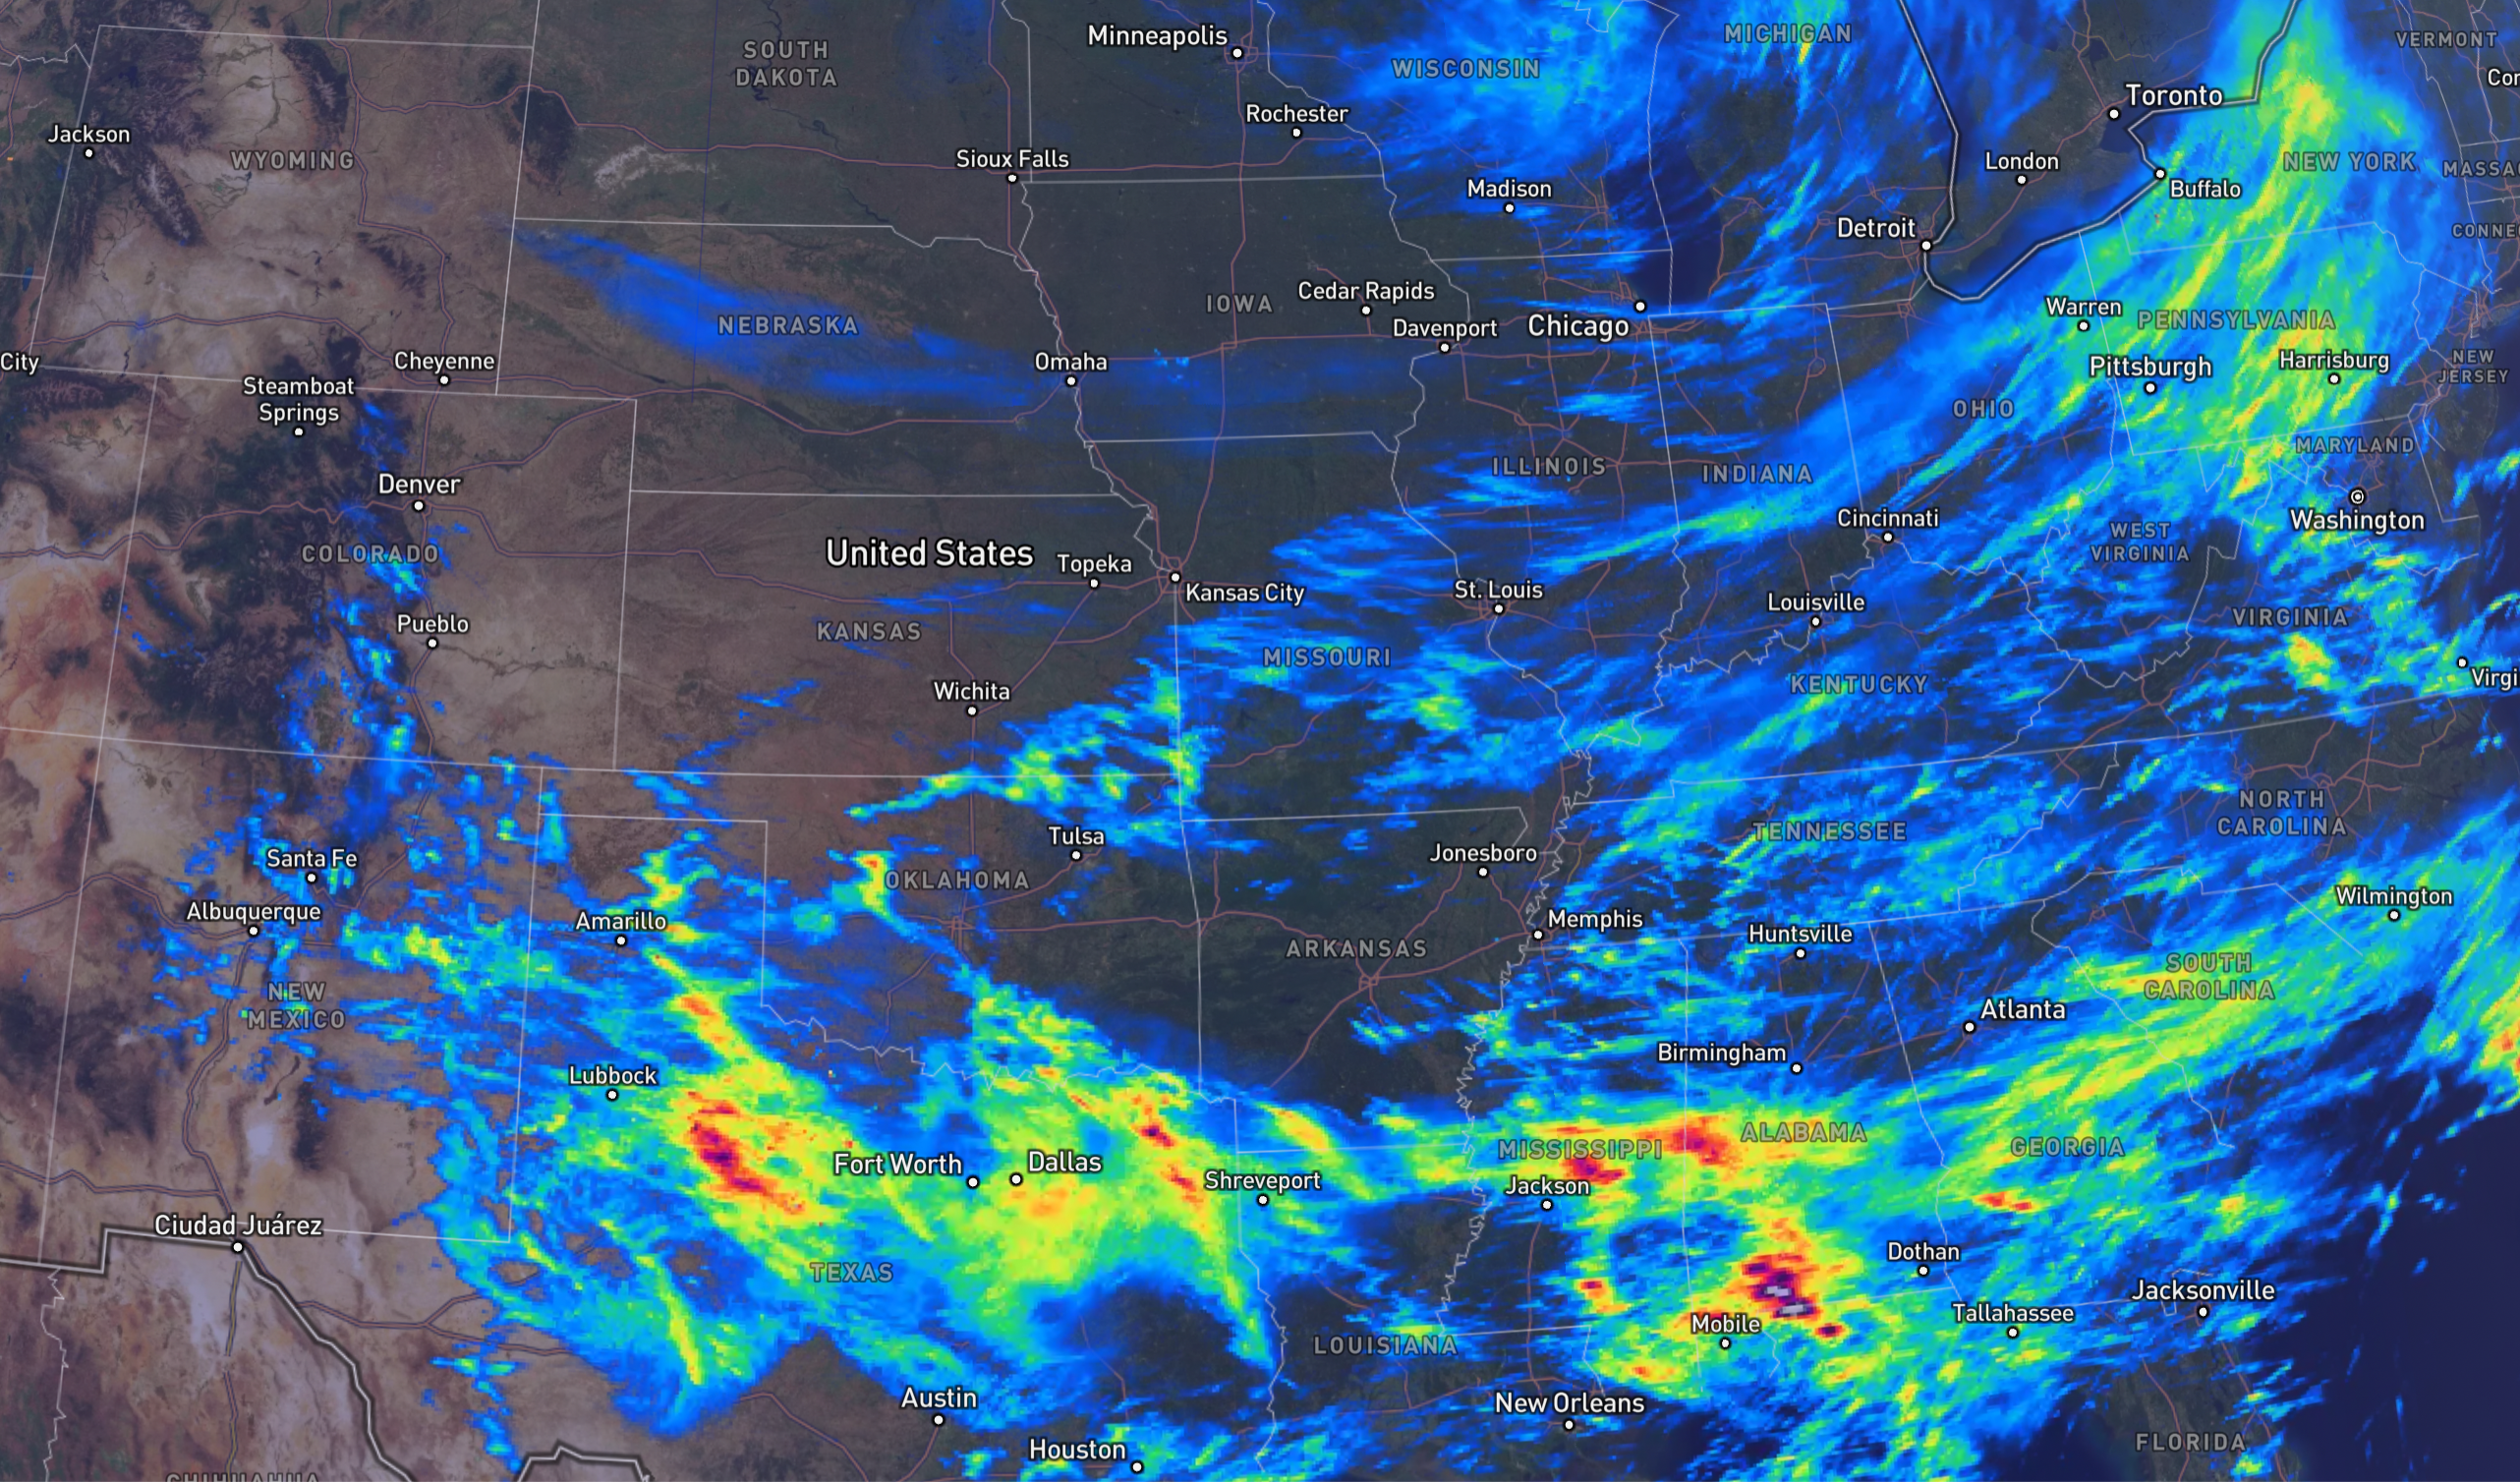
One connected system
Better forecasts begin with a better picture of what is happening right now. The same observation system that measures a storm gives our nowcast its starting point.
Radar sees the storm in motion while quality-controlled gauges anchor it to what reached the ground.
Scientific models align the inputs in space and time, then estimate precipitation at 1 km resolution.
Precip's in-house model carries that high-resolution picture forward through the next 60 minutes.
After the storm, additional observations refine the measured record so the forecast can be checked.
The next 60 minutes
Precip's in-house nowcast starts from a high-resolution view of the storm as it is happening, then tracks where precipitation will move through the next hour. It is built to answer the questions that matter at a point: when rain starts, how its intensity changes, and when it stops.
Nowcast benchmark
Every nowcast, ours included, is checked against independent rain gauges and airport sensors across the US. False alarms and misses both count against a forecast. Higher is better.
Next-hour forecasts checked against 112 research grade rain gauges, hour by hour.
Will it be raining in 10 minutes? In 60? Checked every 10 minutes against 215 airport weather sensors.
Every wrong call over the same 19,600 station-hours.
Two separate tests. The phone apps were scored on hourly totals at rain gauges; the industry providers on rain-or-no-rain at airport sensors. Compare within a test, not across them.
Same rules for everyone. Precip was scored from the forecast it actually published at the time, against the same ground truth as every competitor. Full methodology whitepaper coming.
How the measured record is built
The Precip system uses observational data to track what actually happened, including 180 Doppler radar stations and a quality-controlled network of rain measurement stations.
Raw data gets processed through a series of scientific models that convert raw information into easy to understand precipitation amounts. Part of that process includes aligning data from multiple sources into the correct hourly time periods for reliable analysis.
The final stage creates a proprietary ensemble of the various model outputs to deliver the highest quality blend of low latency and highly refined data, correctly projected for geospatial analysis.
Coverage and resolution
Precip data currently covers the United States, Canada, and some of Mexico, with other regions becoming available upon request.
Our rainfall measurements in the US quantify rainfall for an area of roughly one half mile squared, or 160 acres. In Canada it is approximately 1 square mile or 250 hectares. Rainfall can vary even within an area that small, so our models provide an average value for the area represented.
Live rate, nowcast, and measured precipitation
Measured precipitation resolution
Historical precipitation benchmark
Most sources that show historical rain totals only show the most recent forecast amount before the actual rain could be measured. Precip uses radar and ground-truth observations as rain happens to create the most accurate possible rainfall totals.
Precip's estimates are the best available, but no rainfall estimate is perfect. Rain gauges themselves can provide inaccurate measurements. For example, wind turbulence can cause an average error rate of 2% to 10% when using gauges to measure rainfall. Read why measuring rain with gauges is hard.
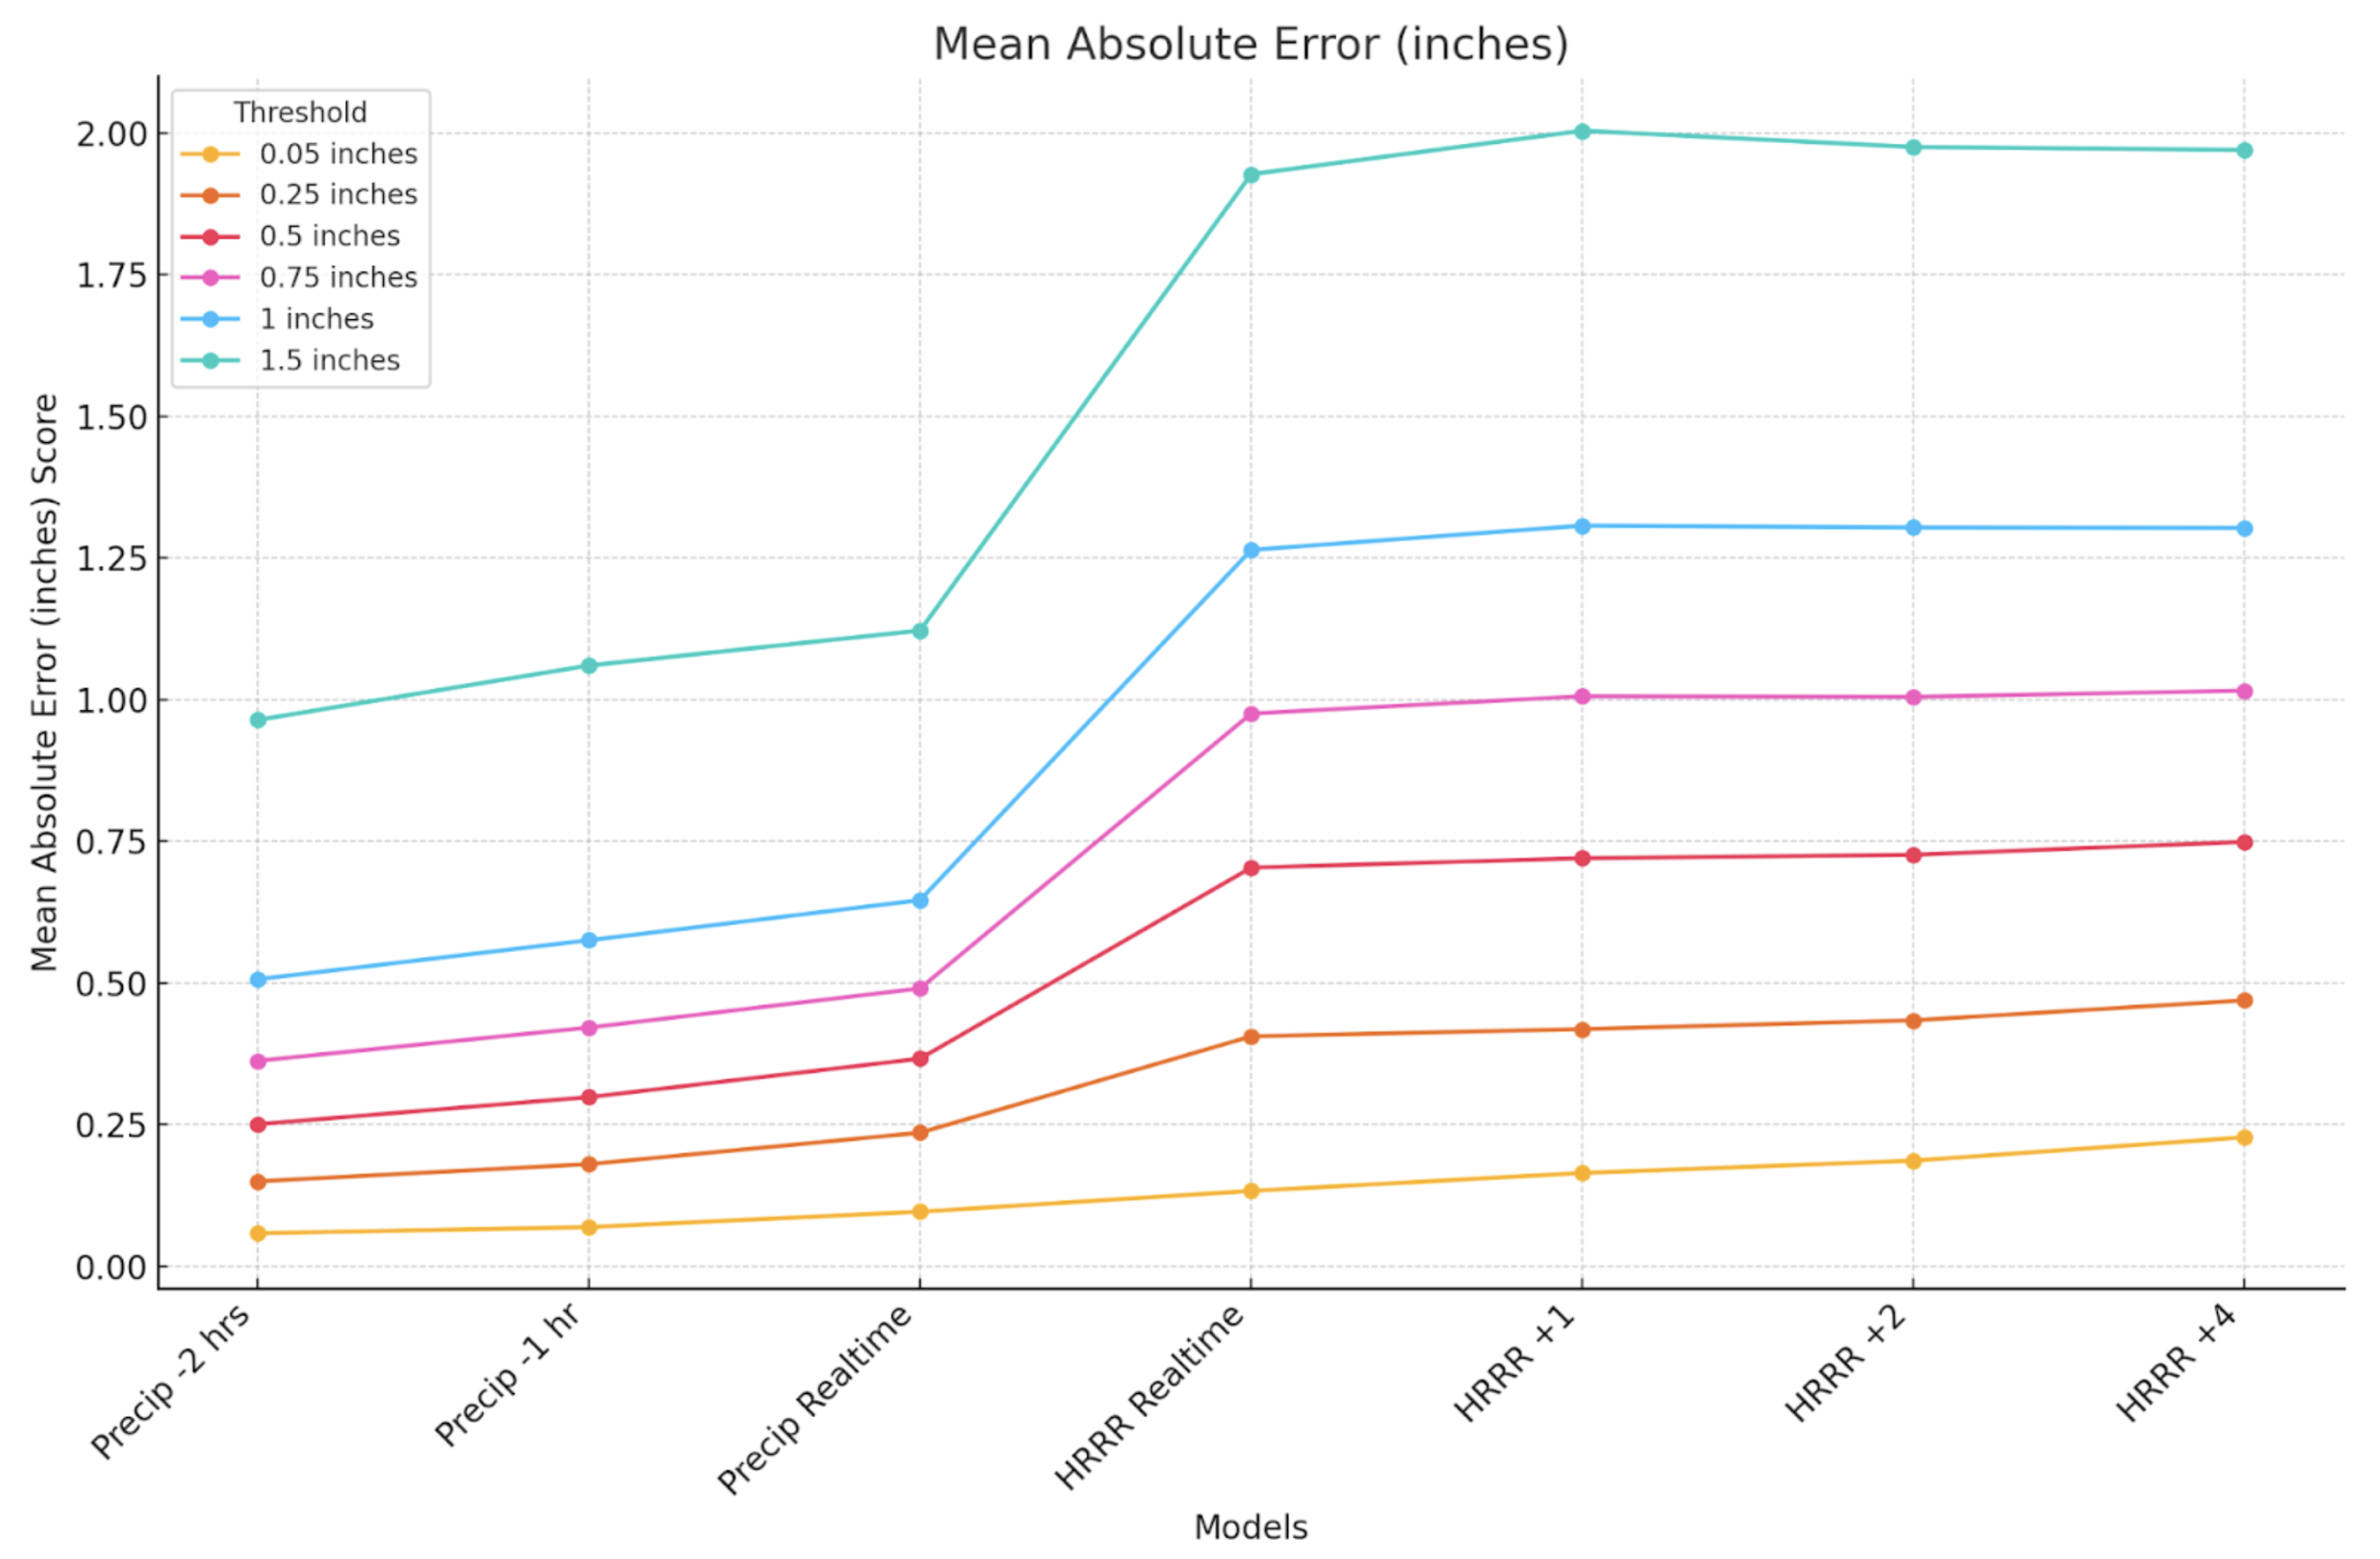
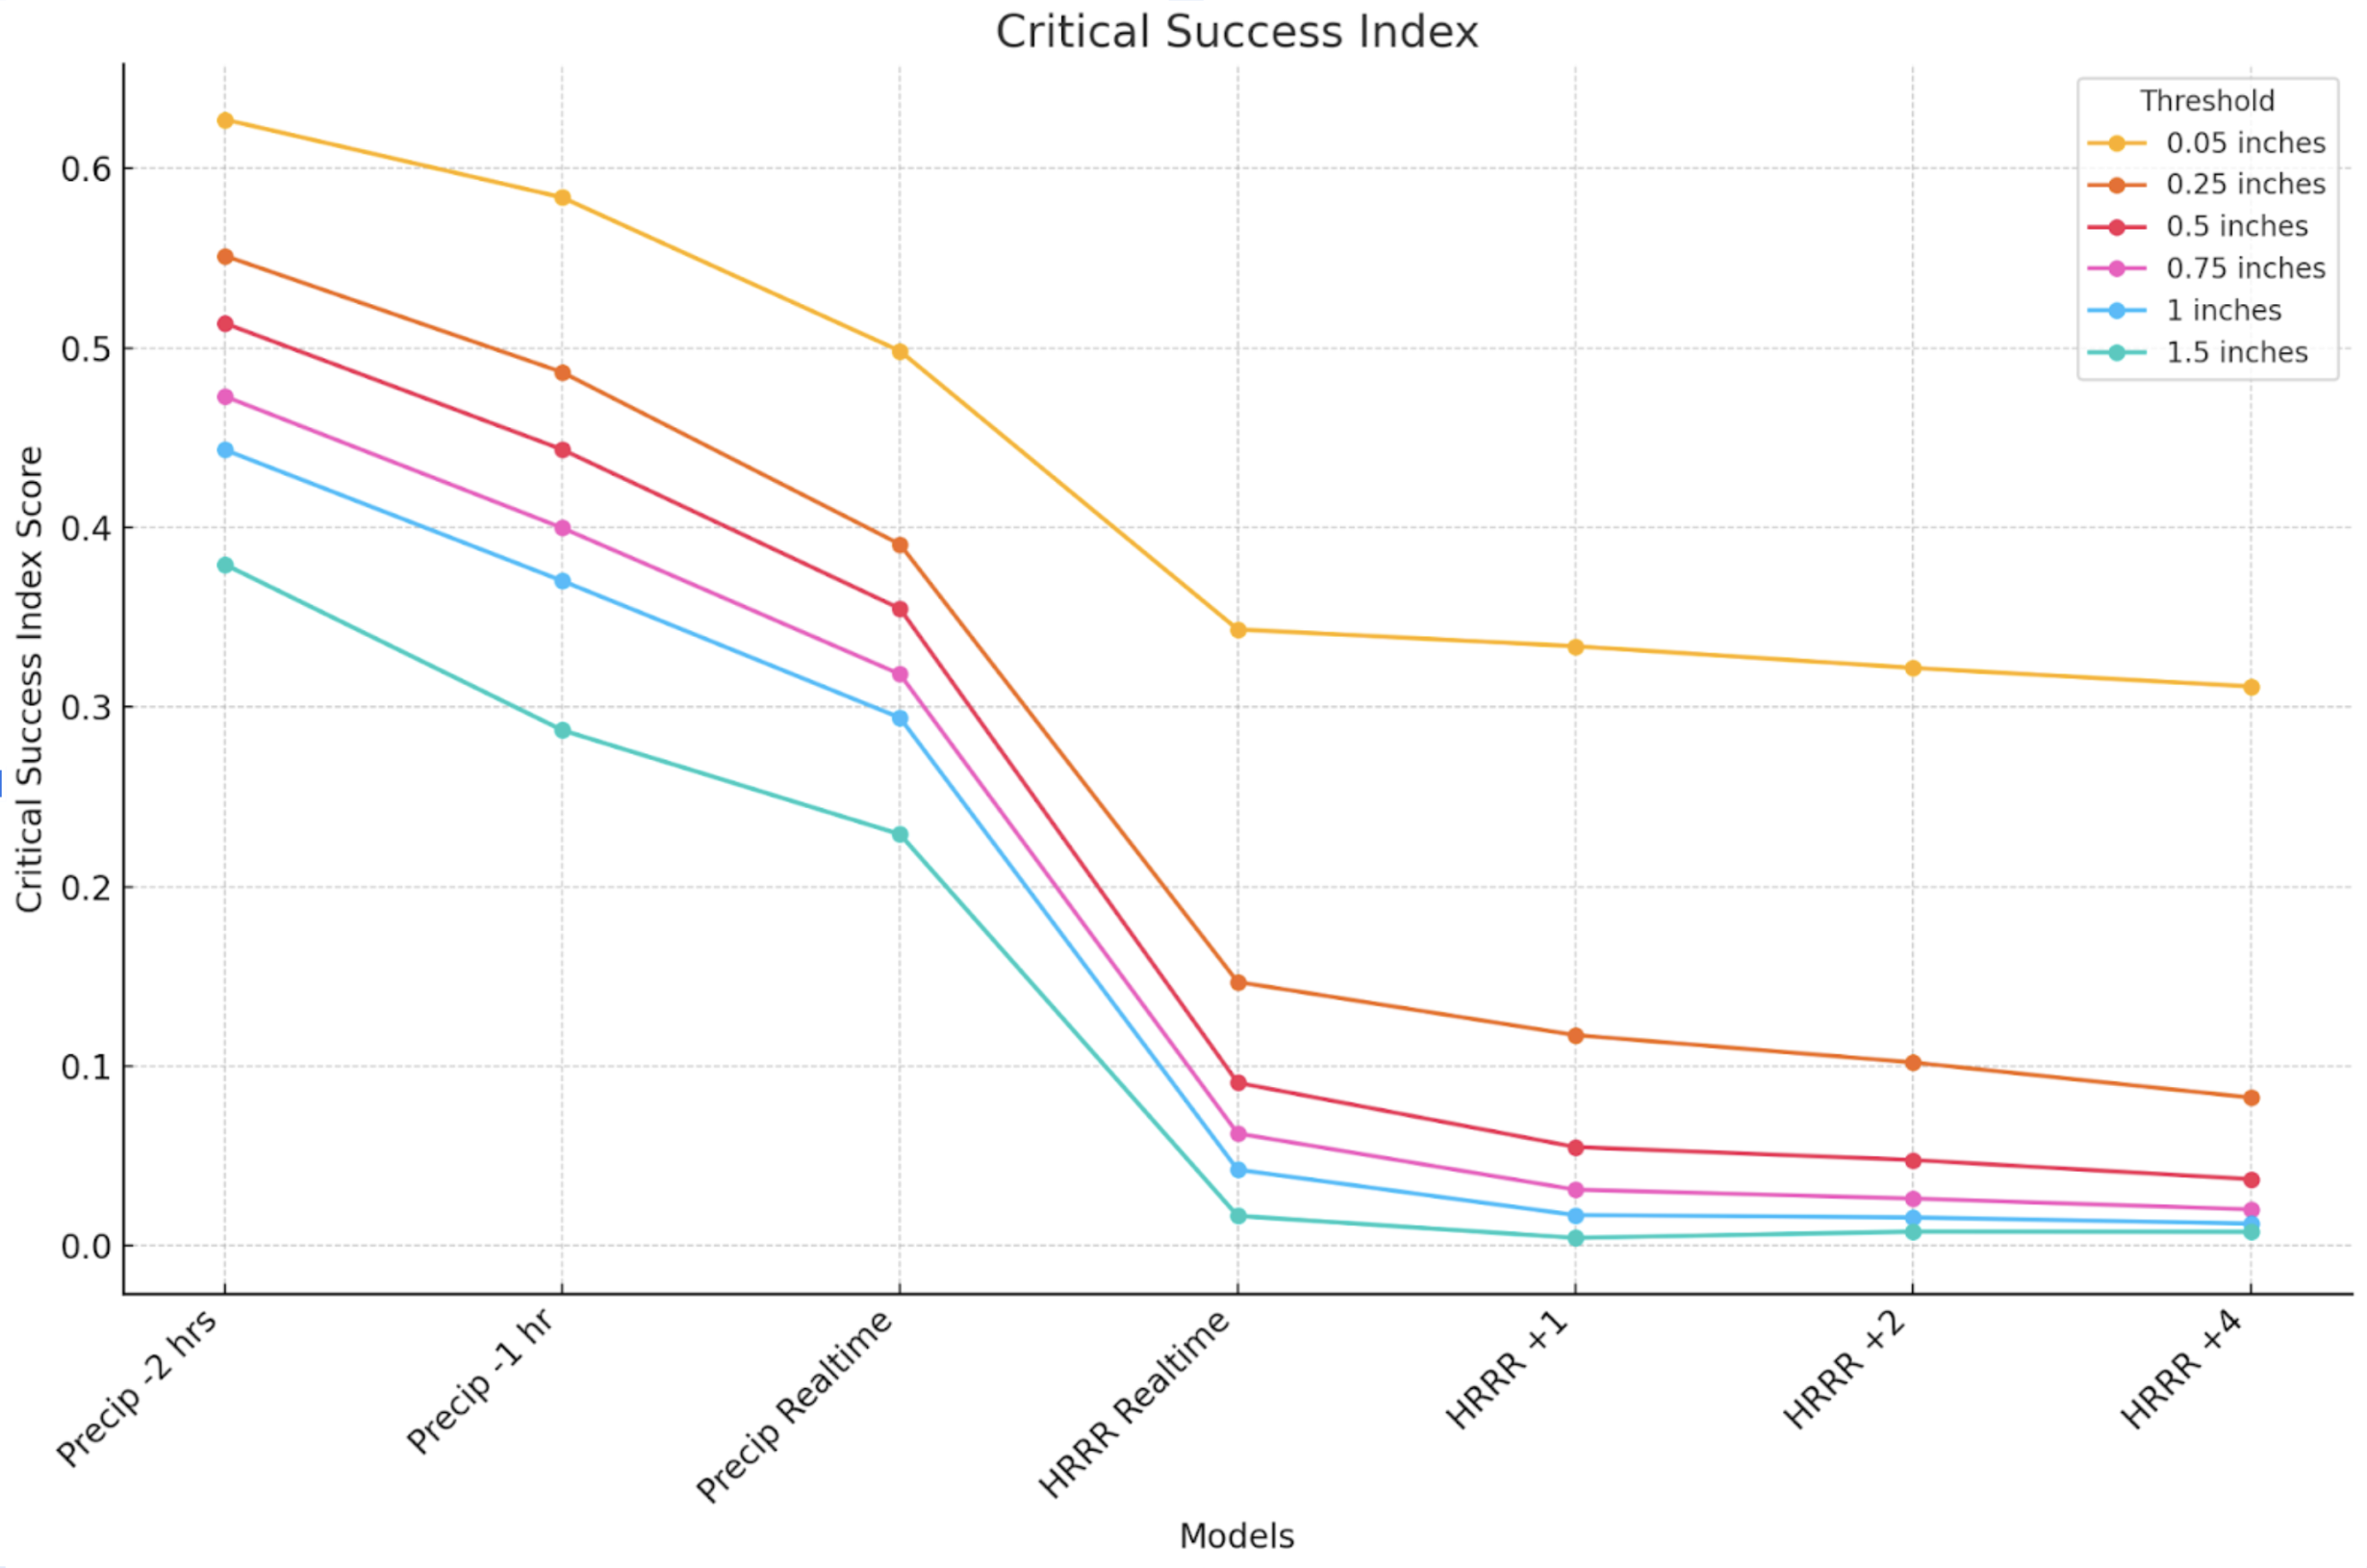
The figures below are excerpts from a 2023 benchmarking study that compared Precip to the High Resolution Rapid Refresh forecast model output and the Integrated Surface Database ground observations. The report analyzes rainfall events at various accumulation thresholds against the corresponding gauge data.
Data provenance
Precip combines our own models and processing with authoritative third-party observations and forecast data.
Know what's next. See what actually happened.
Get Precip free on iPhone, Android, and the web.